Mnemonic Engineering for Pharmacology
A user guide to Ballicules.com
Ballicules.com is a dashboard that draws over 1,500 medications as pictures you can put side by side. Every drug is one decagon whose pegs are the targets it binds, sized by how much each one matters. Search a name, paste a whole medication list, or take a class at once — then read the regimen as a single image.
The fastest orientation is to play with it: search, hover, click, drag, scroll. It works on desktop and on a phone. Each section below ends with a live board you can open.
The interactive console
One board, five kinds of card: the ballicule, the mascot, the interaction avatars, the molecule and the pill. The checkboxes decide which kinds appear, and they work before or after you place anything — check a box and that layer appears for every drug already on the board.
Ballicules
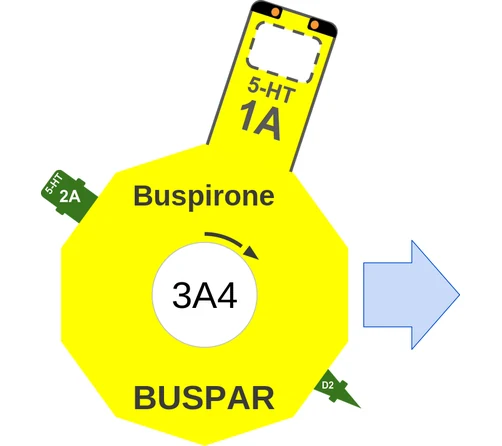
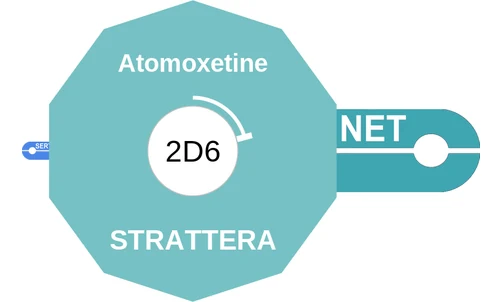
The ballicule is described in Atlas of Psychotropic Mechanisms by Jason Cafer, MD. For psychotropics the neurotransmitter ballicules are the foundational architecture: medications are presented as recombinations of neurotransmitters and anti-neurotransmitters — receptor-specific antagonists and modulators mapped onto a framework arranged and color-coded for memorability. Place the neurotransmitters themselves on the board and you can show that guanfacine is “a piece of norepinephrine”.
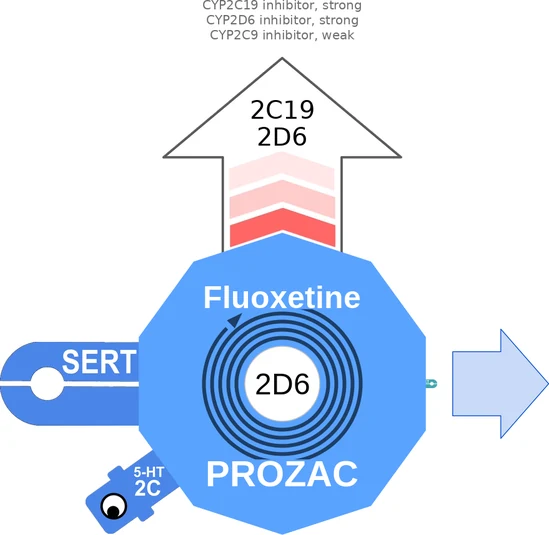
- The ten-sided body is the drug. Generic name above, brand below.
- Each peg is a target it binds. The shape names the target, the color its family, the size how much it matters.
- The hole in the middle is how the body clears it; the coil around it is the half-life — longer coil, longer half-life.
- The arrow out of the top is what this drug does to other drugs: the enzymes it inhibits or induces.
- The pale arrow on the right means it has an active metabolite.
Mechanisms
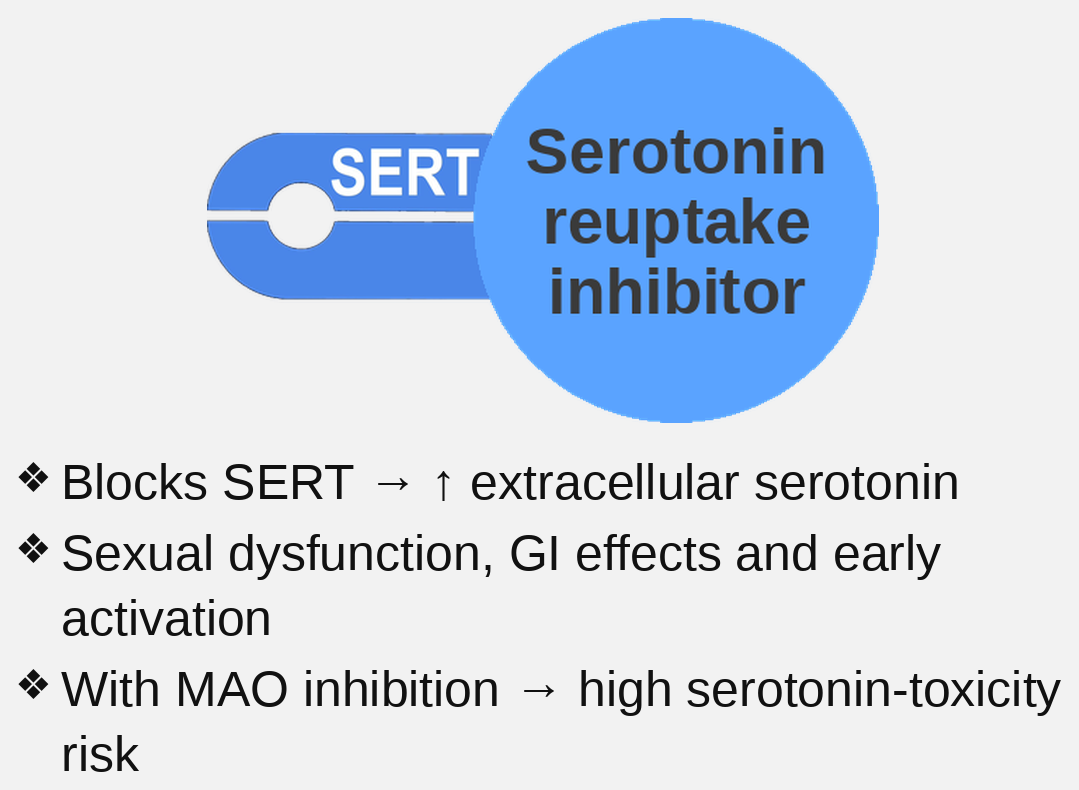
Pegs are mechanisms of action. Peg size varies with the strength of the activity, usually determined by binding affinity at that target.
Click a peg and its mechanism card — a pegball — lands beside the drug: what the target does, and what engaging it costs. Click the peg again to take it away. Hovering previews the card without placing it.
Metabolites
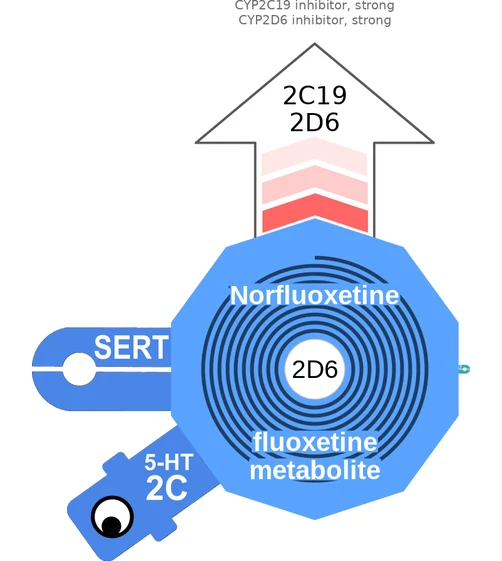
Worth saying plainly, because it is not self-evident: a ballicule is the effect of one molecule in isolation, not the aggregate effect of the drug.
So a ballicule with no pegs — lisdexamfetamine, for instance — is an inactive prodrug. Click the blue arrow to its right and the active metabolite appears, dextroamphetamine in that case. Some active drugs also have active metabolites that shape the clinical picture: quetiapine to norquetiapine, fluoxetine to norfluoxetine with its own pegs and its own much longer half-life. Same blue arrow.
FDA prescribing information
With a single medication on the dashboard, its FDA prescribing information is displayed underneath. With several placed, reach any one of them by clicking that medication’s header.
Label text is quoted, not curated: it appears as the label words it, including where our own pharmacology reads it differently.
The interaction check
With several medications on the board, a pharmacokinetic check runs automatically and estimates how each one changes the others’ AUC — total drug exposure over time. With exactly one medication placed, the panel inverts and lists every medication in the library that interacts with it, without placing their cards.
While the pharmacokinetic tool is under construction, the ballicule array itself serves as a visual pharmacodynamic check. Counting the crimson “red as a beet” antimuscarinic pegs down a regimen, for instance, is an anticholinergic burden scale you can read at a glance.
Pharmacokinetic interactions only, and many values are modeled rather than measured. It is a prompt to think, not a verdict.

Medication mascots
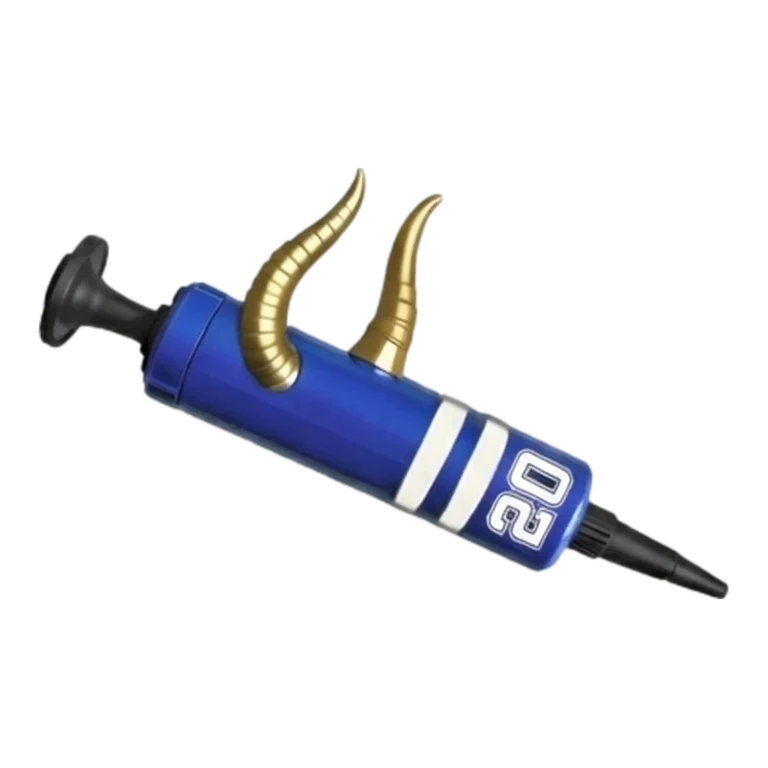
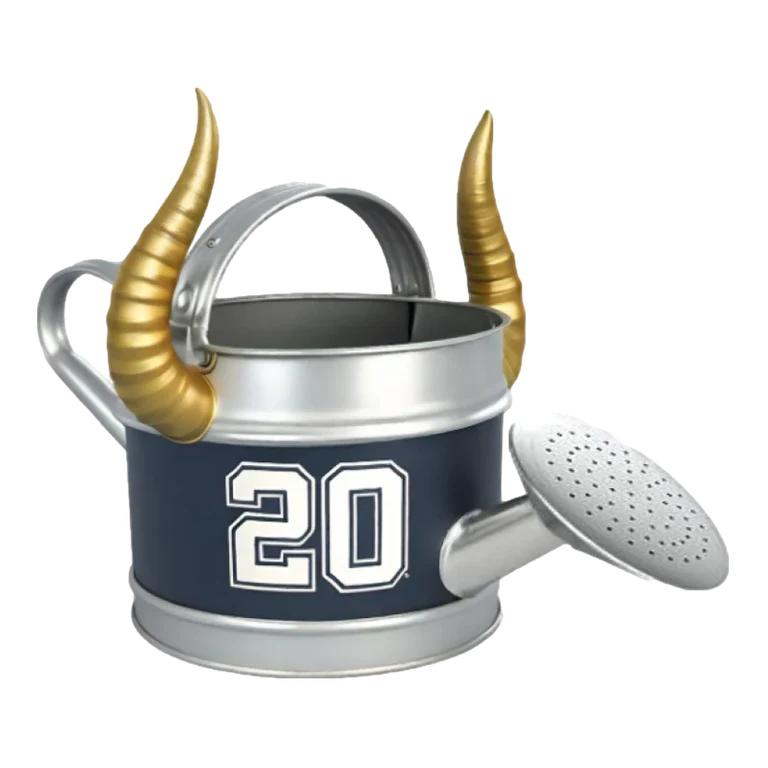
A mascot derives from a mnemonic phrase — a sound-alike built to fix a trade/generic pairing in memory. “Ceph a’ flexin’” for cephalexin / KEFLEX. That makes them well suited to Top 200 and Top 300 drug courses.
The mascot reinforces the phrase, and it sets the theme that every one of that drug’s interaction avatars reuses.
Interaction avatars
Avatars are described in Dr. Cafer’s Pharmacokinetic (PK) Drug–Drug Interactions: Mnemonic Engineering for 100,000+ Pairings.
InHibitors (H for High) and inDucers (D for Down) are the perpetrators of a PK interaction; substrates are the victims. Within each enzyme or transporter system, a victim’s mascot becomes an avatar — elevated by an inhibitor, deflated by an inducer. A mascot in a box avoids most kinetic interactions; a mascot in a bubble does not engage at all.
One drug therefore carries one avatar per role it plays. Fluoxetine is a strong inhibitor of both CYP2D6 and CYP2C19, so its mascot turns up twice, in the same costume, marked for each enzyme.
Whether you want 100,000 pairings or ten, the system scales: interactions become predictable instead of tabular. Hover or click an avatar for its meaning.
Molecules
Check the molecules box for the skeletal structure of any medication — useful for comparing drugs built on the same scaffold. Each structure carries a plain-language description; click a phrase in the description and the atoms it names light up, and click an atom group to find the phrase. Click again to unpin.
Structurally similar drugs are listed underneath; click one to add it.
The fluoxetine structure beside this paragraph is the live card, not a picture of one — try it here.
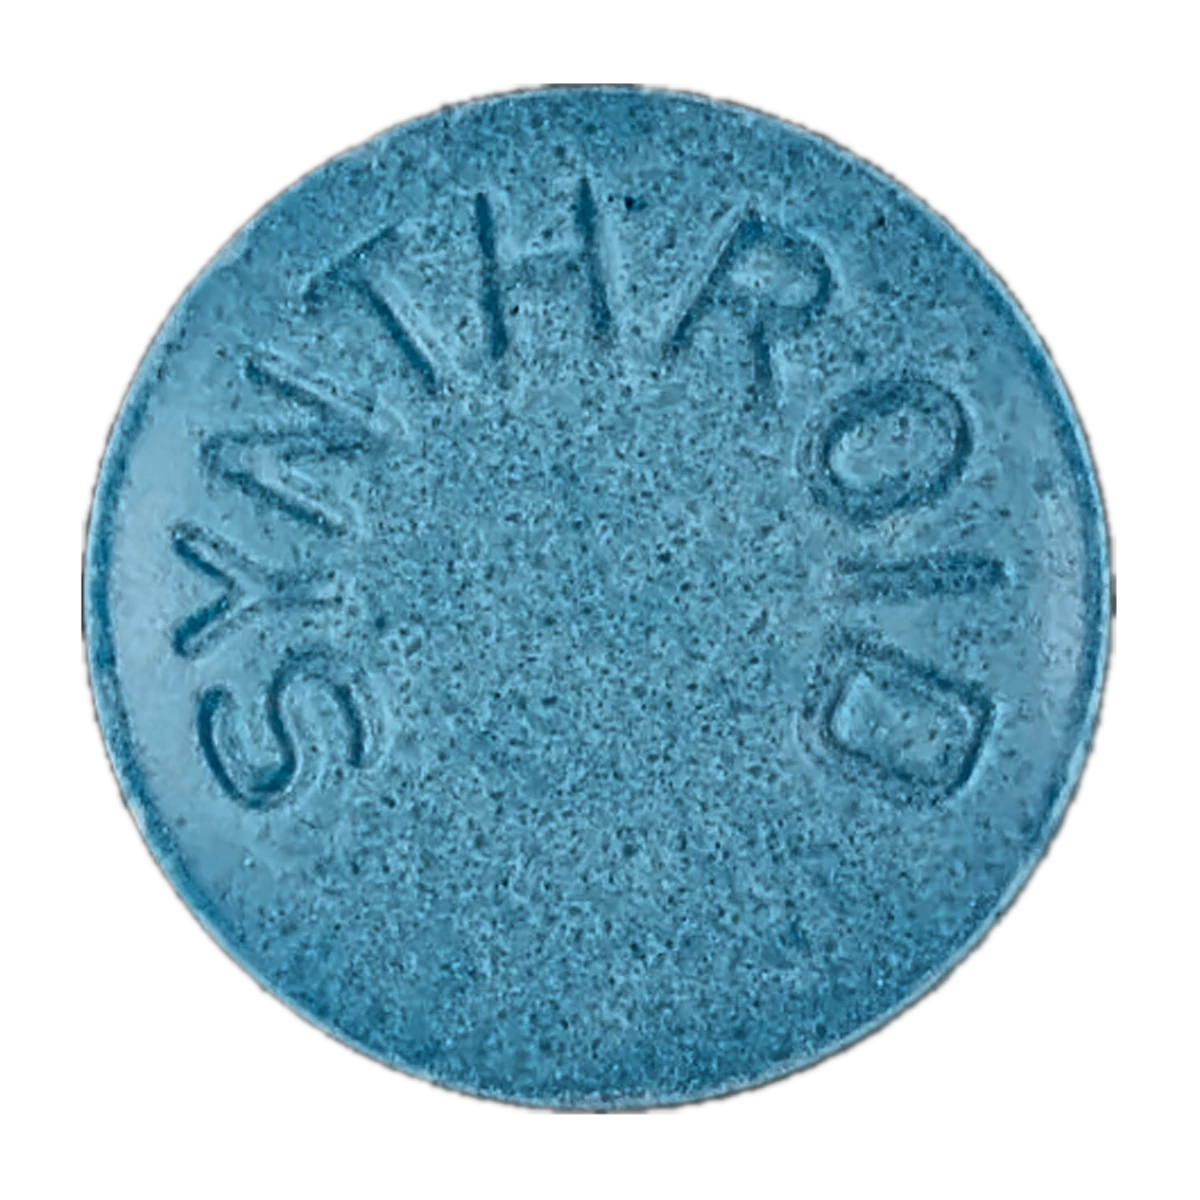
Pills
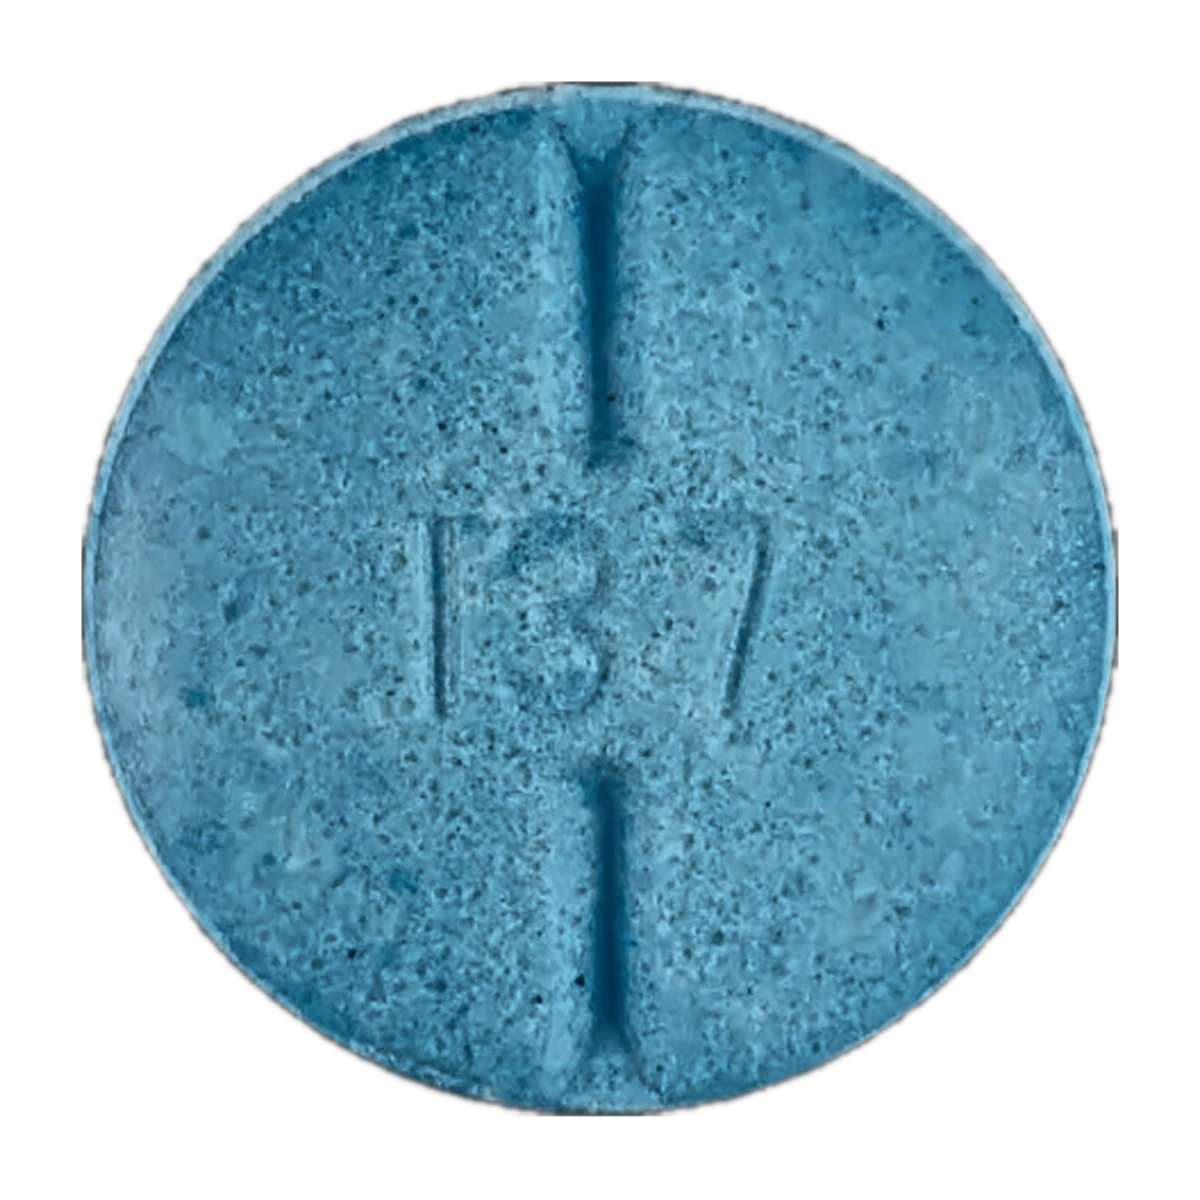
What the product actually looks like, with the strengths it is made in. Hover the tablet to see its other face — the one beside this paragraph flips, like the card does.
The photograph library is far from complete, and a drug with no verified picture simply shows no pill card. To see only the ones that do have a photograph, use Drugs with pill images in the Classes menu.
Slideshows
On desktop, clicking a card’s header opens that drug as slides. Navigate with the left and right arrow keys; leave with Esc. On a phone the same header opens the drug’s web page instead.
Teaching with it
The dashboard is built for visual analysis of a medication regimen, which makes it a presentation surface as much as a reference. Clicking a peg places the pegball that explains that mechanism; clicking an avatar places the explanation of the interaction role it represents. Build the board you want to talk from, then click Copy Link — the arrangement travels in the URL, so a saved board opens for your audience exactly as you left it.
Getting around
- Search — type a name, or paste a whole medication list.
- The four menus — Classes, Clinical uses, Mechanisms and Interactions each drop a whole set on the board at once.
- The checkboxes — ballicules, mascots, interaction avatars, molecules, pills.
- A card’s header — opens that drug as slides, or as a web page on a phone.
- [×] — closes that one card, not the whole drug.
- Drag a card to reorder the board; Clear empties it; Copy Link saves it.
What the #number means
A drug page headed #12 Metoprolol succinate ER (TOPROL-XL) is saying that it is the twelfth most-prescribed medication in the library, by our 2024 estimate of US prescription volume across all payers.
Most published "top 200 drugs" lists rank by Medicare Part D, because CMS publishes that file for free. Part D covers people 65 and older and the disabled, so it is an excellent record of what that population takes and a poor proxy for the country: on the raw Part D list cetirizine is 830th and cholecalciferol 1,295th, while diltiazem is 68th. Our ranking starts from those Part D counts and corrects them, fitting the correction to MEPS — the federal all-payer household survey — with Medicaid volume as a second predictor.
It is an estimate, and worth about what an estimate is worth. Drugs a few places apart are not meaningfully in order, and ranks run among the medications this library carries rather than among every drug in the country. The method, and how far to trust it · the unmodified CMS 2024 ranking · the top 200.